About VMT
Introduction
New rust races are constantly evolving locally or via incursions from remote areas. In Ethiopia recent known incursions were stem rust race TKTTF (Digalu race), first detected in Turkey 2005 and causing major epidemics in Ethiopia in 2013, - especially on the main grown variety Digalu (Olivera et al., 2015). The Yellow rust race PstS11 caused major outbreaks in Ethiopia in 2016-2020. This race was first detected in Afghanistan in 2016. Currently (2021) a new, virulent yellow rust race PstS16 is threatening wheat in Ethiopia. This race was first detected in Afghanistan & Pakistan in 2018. The objective of the Vulnerability mapping tool is to identify vulnerable areas in Ethiopia in advance, to permit early warning and preparedness.
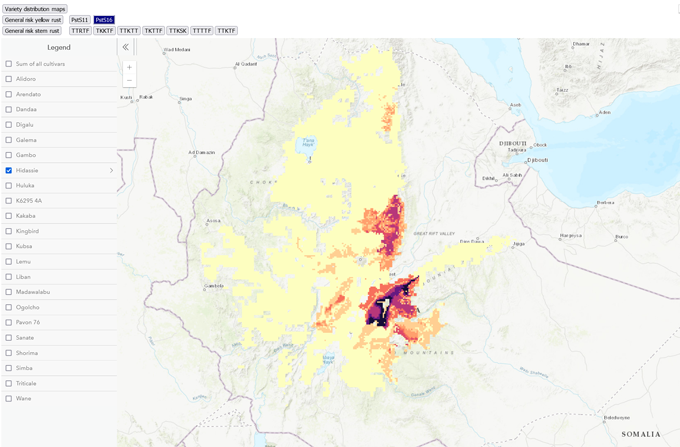
The vulnerability mapping tool is under construction in the frame of the Accelerating Genetic Gains for Maize and Wheat (AGG) project, funded by BMGF & UK FCDO. The tool calculates the regions in Ethiopia most vulnerable to attacks of specified yellow rust or stem rust races depending the cultivars grown and suitability / risk of disease. The user selects the YR or SR rust race to combine with distributions of major wheat cultivars and risk of disease. The model combines the known YR or SR race virulence’s with the selected cultivars known resistance genes, combined with performance of the cultivar in field test with known races. This calculates a total affection rate for race by cultivar. This is combined with a GIS layer for Yellow or Stem rust optimal conditions (weather / elevation / soil type) and a layer for the distribution of the cultivar in the country.
The maps shows which areas are most vulnerable for epidemic development of the YR or SR race selected (i.e., high frequency of susceptible cultivars to a specific race and highly suitable environment for disease development). We will implement results for key YR and SR races already present in Ethiopia but also for races that might appear in the country in the next coming years. You can see where the Yr or SR races, were recorded recently in Ethiopia and beyond by selecting some of the mapping tools in the right menu e.g. Races on single locations.
Application methodology brief
The risk is calculated from variety distributions, affection rates (race * variety) and a general risk map. The methodological approach is described in Hodson et al., 2020:

In the current version of the Vulnerability Mapping Tool, variety distributions have been updated using DNA fingerprinting sample data from 2018/19 (Hodson et al, 2020) and wheat rust survey data from 2018 to 2020. The yellow rust risk map was also refined based on elevation ranges that more accurately reflect yellow rust disease pressure in Ethiopia, based on field observations. The ranges used were:
Elevation Range (m) | Yellow Rust Risk |
|---|---|
2000 - 2200 | Very Low Risk |
2200 - 2400 | Low Risk |
2400 – 2600 | Moderate Risk |
2600 - 2800 | High Risk |
2800 - 3300 | Very High Risk |
| Partners | |
|---|---|
Jens G. Hansen, Eva Overby Bach, Mette Balslev Greve & Margit S. Jørgensen | |
David Hodson & Yoseph Alemayehu | |
| Stefan Einarson |
C. Yirga |
Contribution from local partners in Ethiopia:
-
Tigray Bureau of Agriculture and Rural Development
-
Southern Nations, Nationalities, and Peoples Region Bureau of Agriculture


